Malignant brain tumors, particularly the gliomas, are among the deadliest of tumors; many patients, including children, die within 2 years. It has been suggested that the migration of cells is critically dependent on their shape and size, their binding to various proteins in the extracellular space (ECS) that can boost tumor invasiveness, and on the size and geometry of the ECS. The Department is currently studying the changes in ECS diffusion parameters in tumors and how these changes might affect drug delivery to brain tumors. Using diffusion analysis based on ion-selective microelectrodes and optical imaging, we have been studying the migration of molecules and drugs through the ECS in brain slices of normal and malignant tissue obtained from patients during neurosurgery. Attempts will be made to modify the diffusion parameters in order to decrease tumor invasiveness.
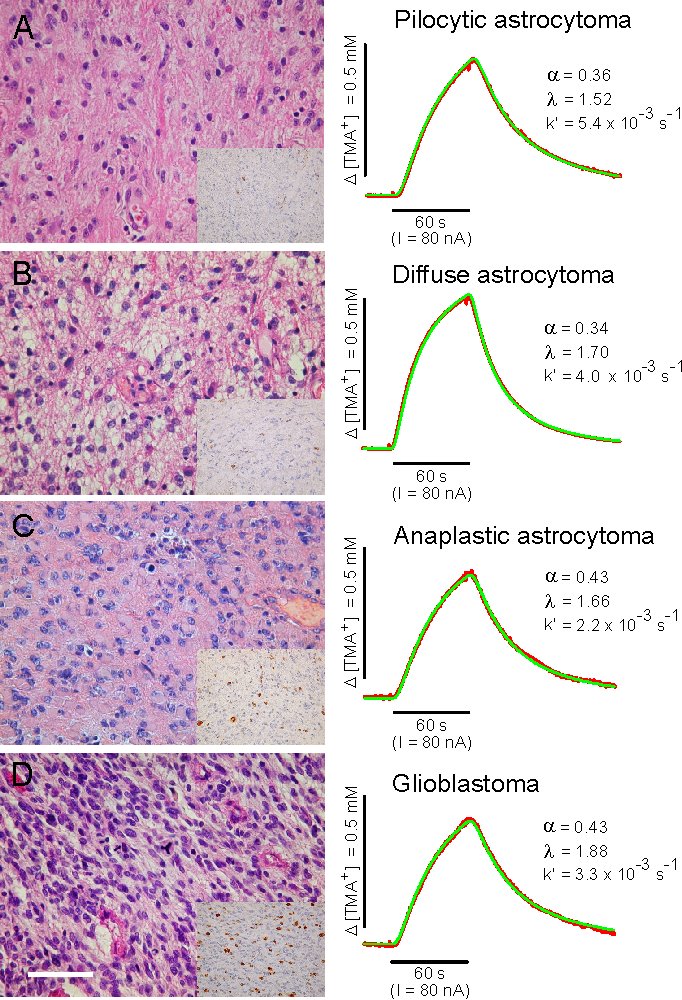
Fig. 1: Left: Hematoxylin-eosin staining of the studied brain tumor tissues and the corresponding immunolabeling for Ki-67 to determine the MIB-1 labeling index (MIB-1 LI) shown in insets. Right: Representative TMA+-diffusion curves recorded in each distinct type of tumor with the corresponding values of the ECS diffusion parameters a, l and k´. The red lines represent the actual diffusion curves recorded in the tumor samples; the green lines represent the theoretical diffusion curves generated by the nonlinear curve-fitting simplex algorithm (see Methods). A: pilocytic astrocytoma (WHO grade I), MIB-1 LI 0.6 (case 9 in Table 1). B: diffuse fibrillary astrocytoma (WHO grade II), MIB-1 LI 3.8 (case 11). C: anaplastic astrocytoma (WHO grade III), MIB-1 LI 19.4 (case 13). D: glioblastoma (WHO grade IV) –cellular part, MIB-1 LI 23.0 (case 16). Scale bar = 50 mm.
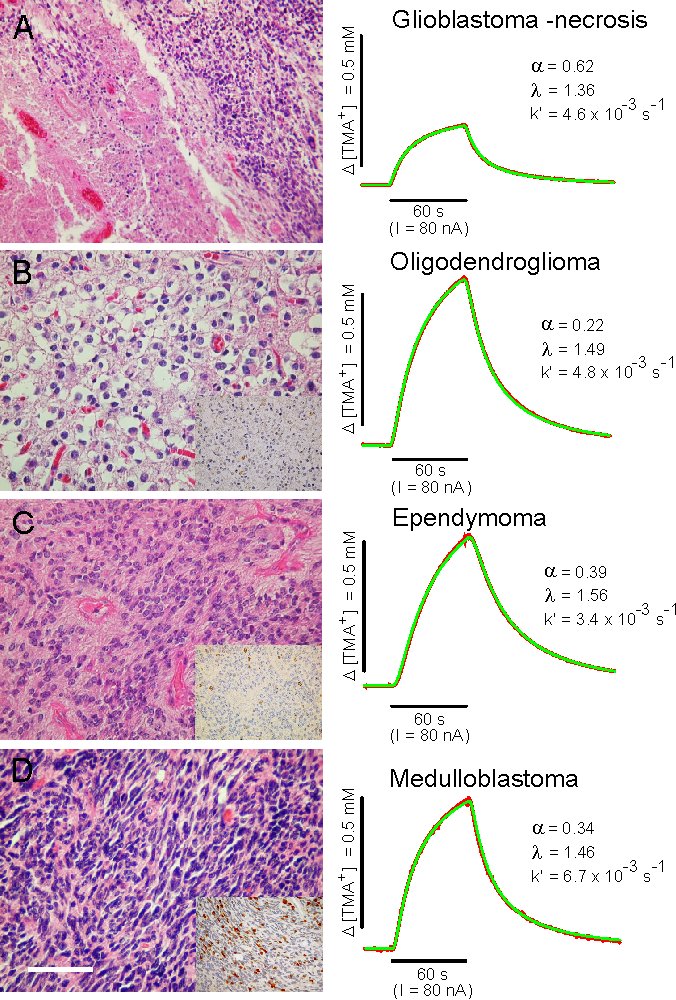
Fig. 2: Tumor tissue samples stained with hematoxylin-eosin with the corresponding MIB-1 immunostaining (insets) and representative TMA+-diffusion curves. The red lines represent the actual diffusion curves recorded in the tumor samples; the green lines represent the theoretical diffusion curves generated by the nonlinear curve-fitting simplex algorithm (see Methods). A: glioblastoma (WHO grade IV) –necrotic region (case19). B: oligodendroglioma (WHO grade II), MIB-1 LI 2.2 (case 20). C: ependymoma (WHO grade II), MIB-1 LI 7.8 (case 22). D: medulloblastoma (WHO grade IV), MIB-1 LI 20.8 (case 26). Scale bar = 50 mm.
|
|
Fig. 3: The relationship between the extracellular space volume fraction a, tortuosity l, nonspecific cellular uptake k´ and the MIB-1 labeling index (on the x axis) in the studied diffuse astrocytomas (WHO II-IV; black circles). Control data (white circles) are plotted against MIB-1 LI = 0. Each point represents an average value of a, l or k´ ± S.E.M. calculated from 2-3 measurements in different slices. Slices from the same tumor have the same MIB-1 LI values. The regression curves for a, l and k´ have correlation coefficients of 0.84, 0.46 and 0.24, respectively. |
|
|
|
|
|
|
|
MIB-1 |